Reports and Presentation
Summary
I was assigned to the Machining Division of Marine Propulsion Systems, BRP Inc. I primarily worked on the following projects:
-
Determining the switch over point for a particular product from high product mix machining to cellular machining.
- Identify the capacity of the current setup.
- Identify the utilization of the current setup.
- Identifying dynamic bottlenecks in real-time.
- Devising computational methods for dynamic scheduling to increase the production as much as possible without switching over to a cellular manufacturing layout.
- Running simulations of the proposed cellular setup to estimate the cell’s utilization and throughput.
- Suggesting configurations (with simulated results) for the new cell
- Build a generalised scalable API, which can used on any product current or future.
- Sample Output
CONFIGURATION 1 1000 Simulations Product Average Products Al Bore Leak Test Sleeve Build Iron Bore Hone Break Wash Inspect Time 1 HAWK 5.0 32.9 1.4 2.3 1.9 85.5 8.3 0.6 9.3 1.6 143.8 2 I2 5.0 30.8 1.0 2.1 2.5 87.6 8.3 0.6 9.3 1.5 143.8 Products Manufactured per Shift (95% Confidence) Prod1 Prod2 High 5.08 5.05 Average 5.01 4.98 Low 4.95 4.92 Average time per product per shift (95% Confidence) Prod1 Prod2 High 144.55 145.45 Average 144.05 144.95 Low 143.55 144.44 Utilization: Operator: 34.54% Al Bore: 81.27% Leak Test: 1.83% Sleeve: 3.27% Iron Bore: 65.87% Hone: 8.17% Wash: 11.50% - For sample code please visit this
-
Calculate accurate lead times for any product being produced on the assembly line
-
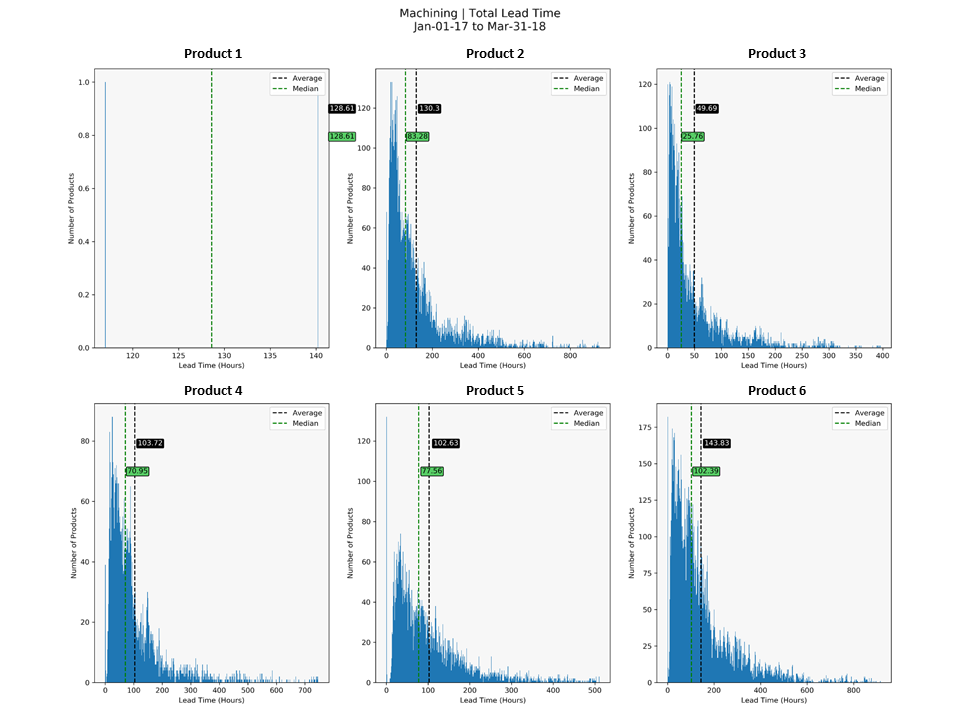
Often times, the variability in the production is high. Therefore, it gets difficult to quote the lead times.
-
This tool detects and removes the outliers, from the dataset, to reduce the weightage of chance events. Also, it substitutes the use of average with median because the data can be skewed as well. And average as a quantity is biased towards extreme values whereas median remains unaffected.
-
Sample Output

-
For sample code please visit this
-

